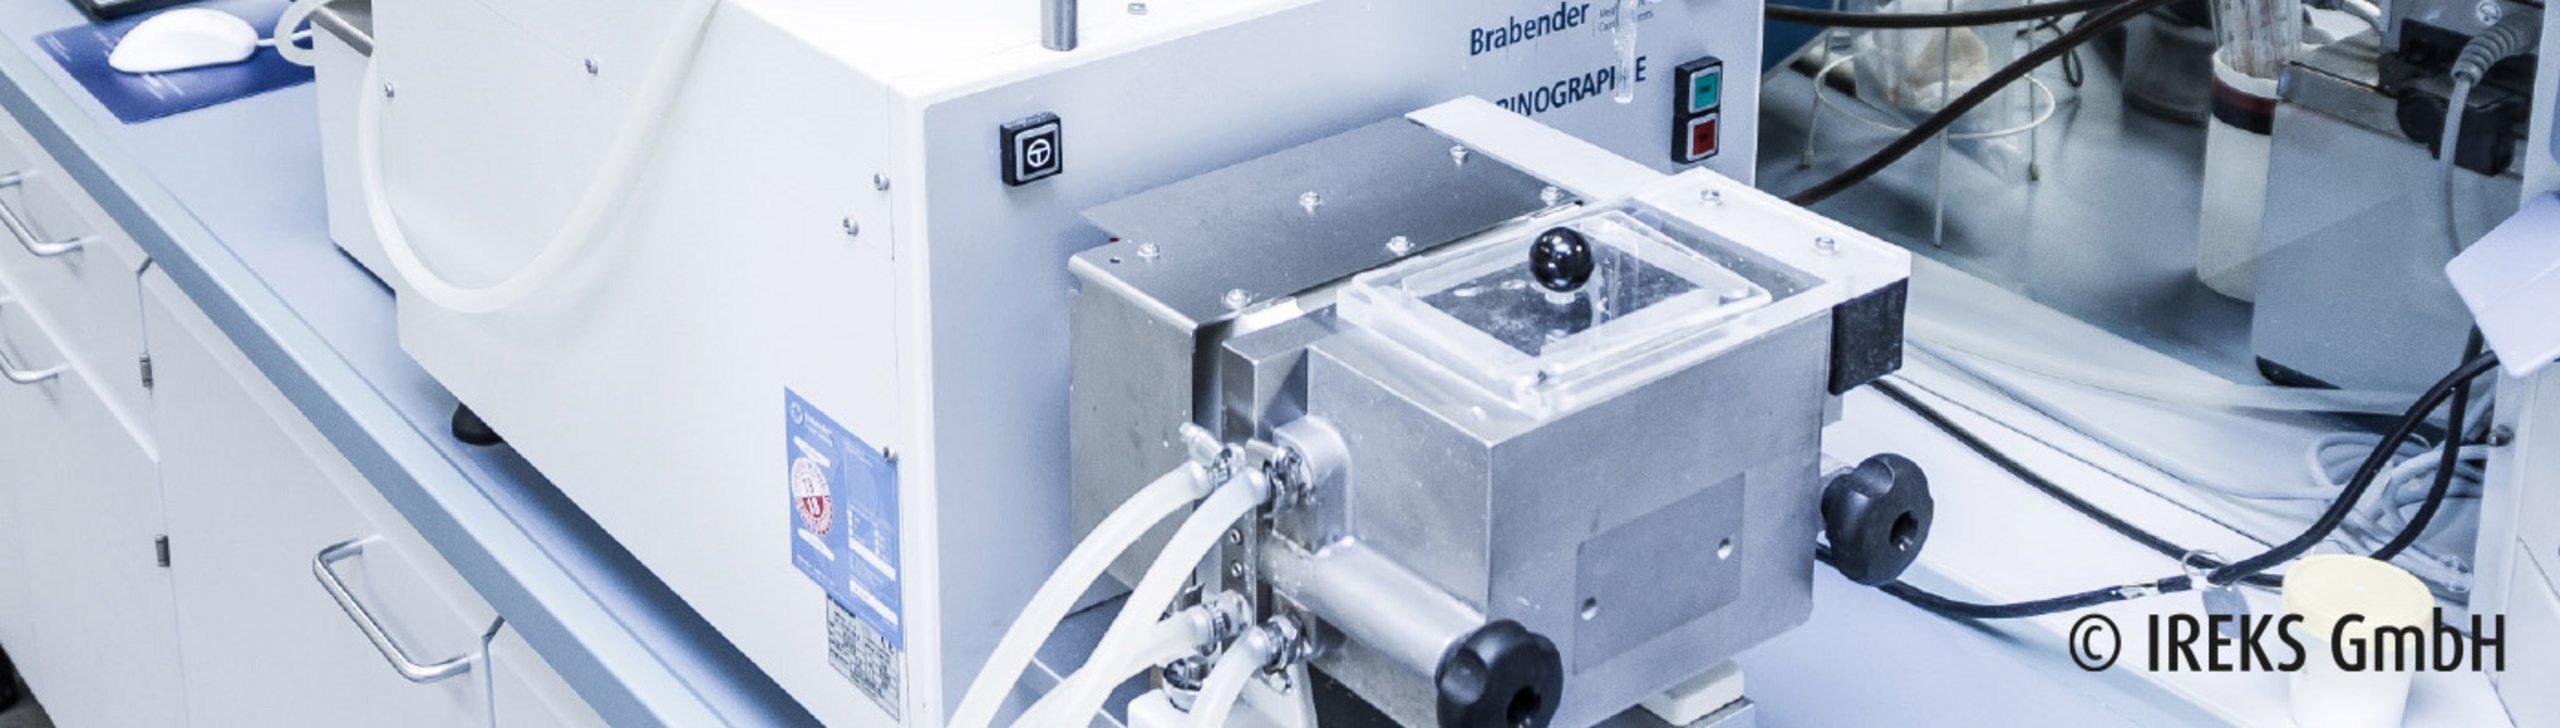
With the help of the farinograph, a dough with a defined dough firmness (viscosity) is produced in a mixing chamber. Here, a mixing curve is created – the farinogram. The farinogram provides information on the water absorption capability and the mixing properties of a wheat flour.
When implementing this, 300 g of flour (with 14 % water content) are scaled into the mixing chamber and a dough prepared. Here, as much water is added that the centre of the mixing curve reaches a dough firmness of 500 farinograph units (FU), before it subsequently falls again.
Evaluation
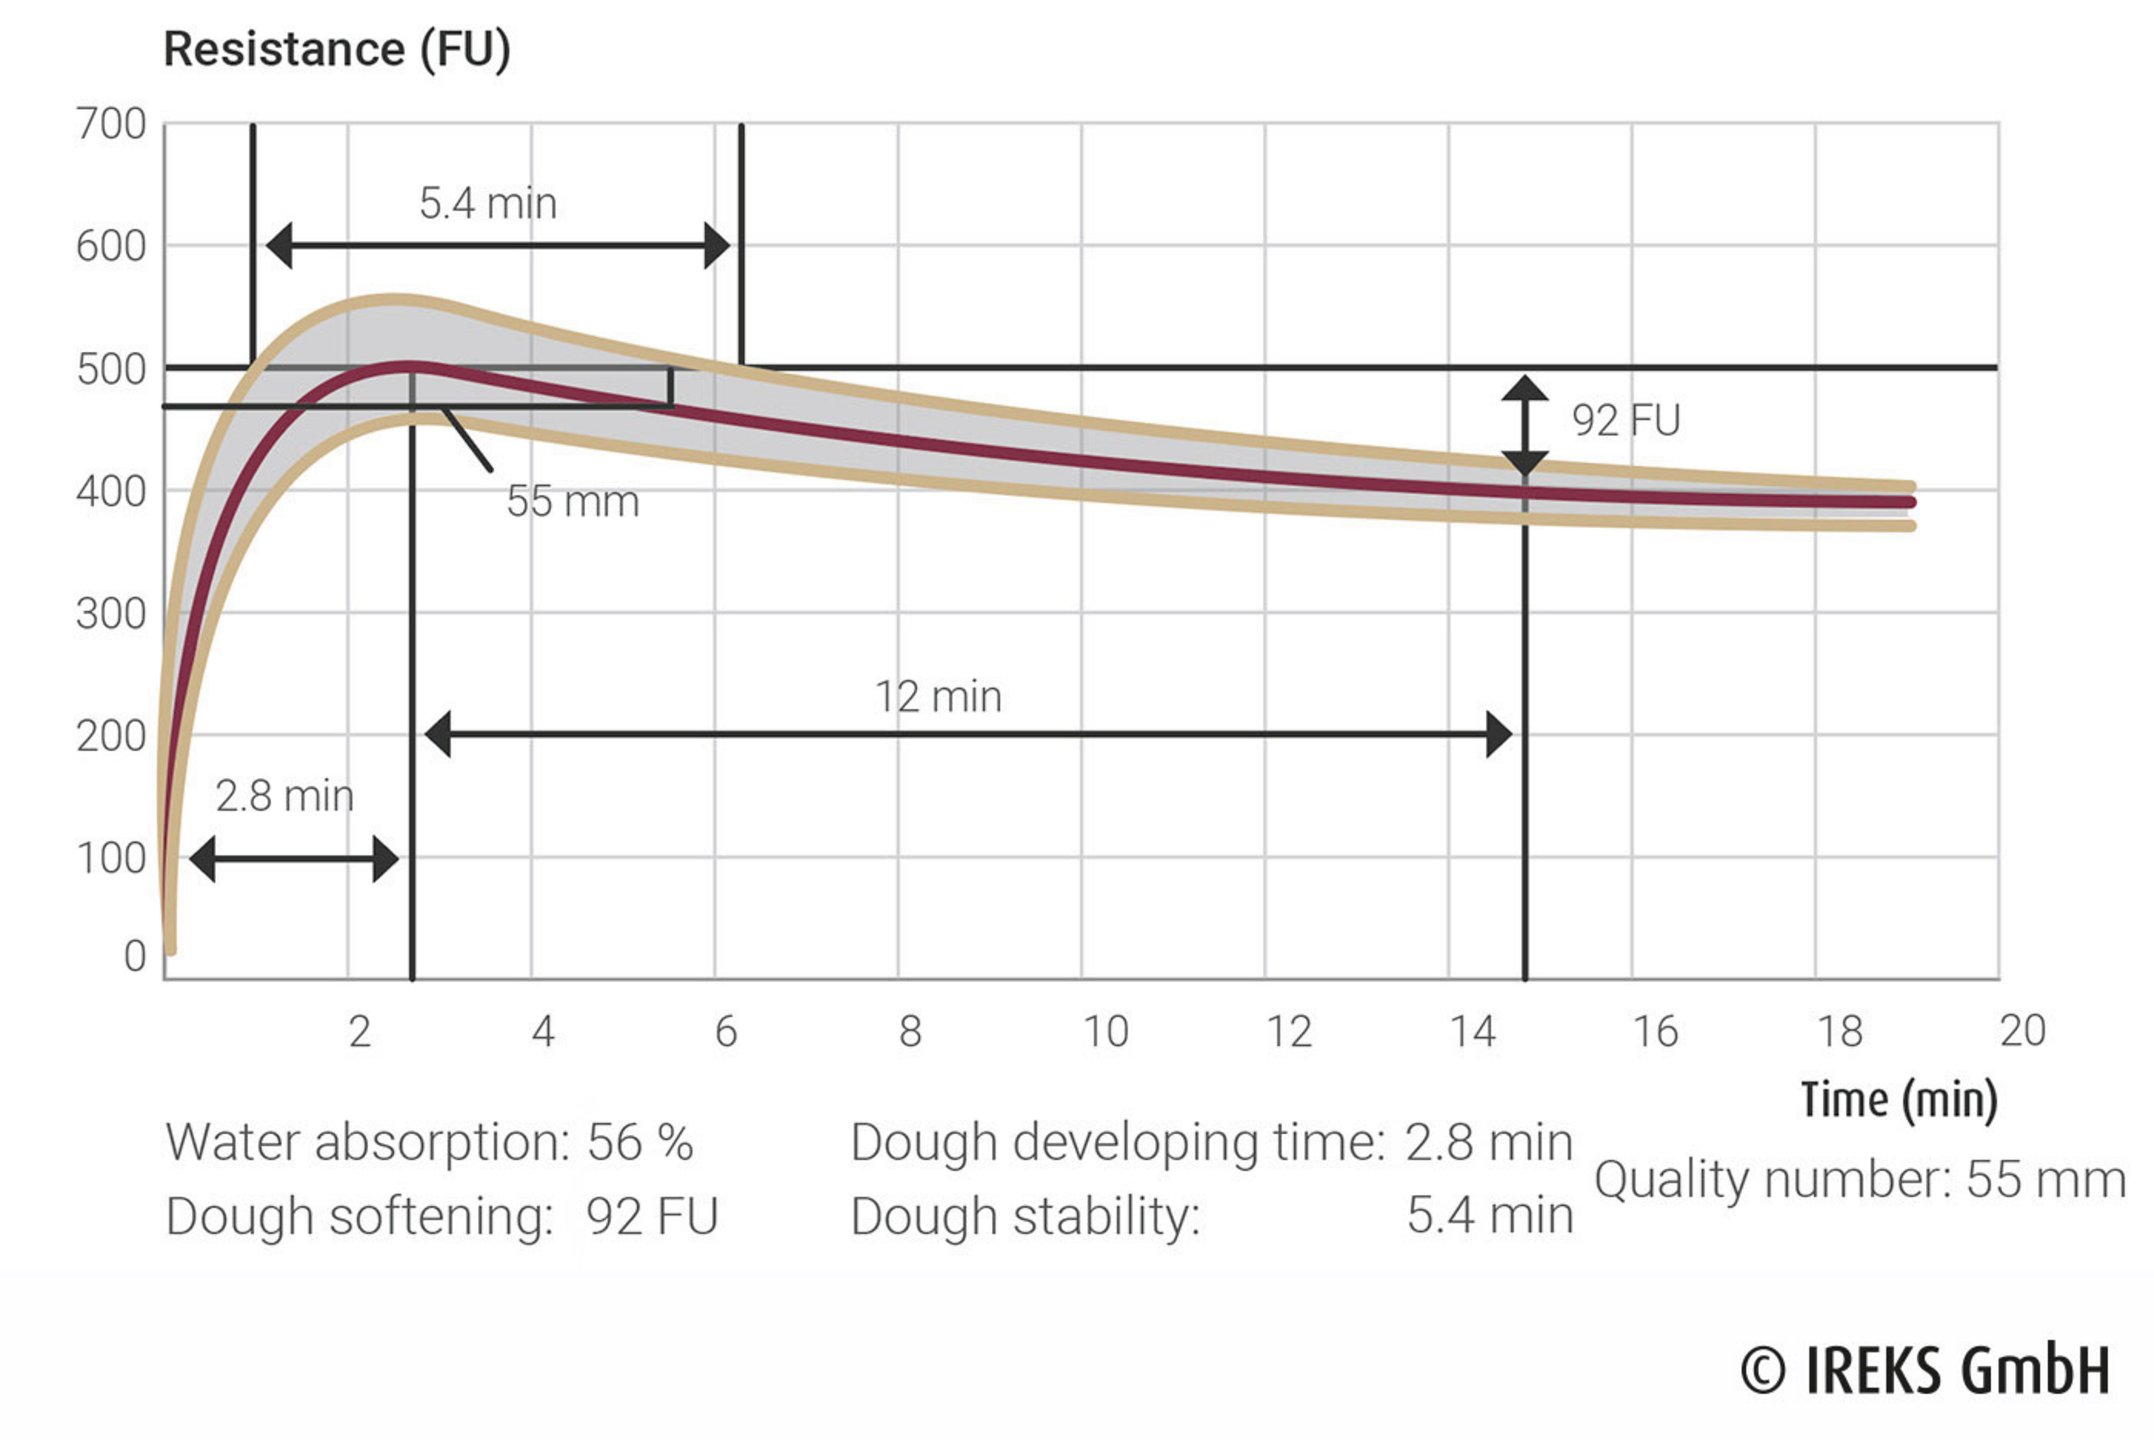
The water absorption describes the quantity of water in percent which is necessary to obtain a dough with a consistency of 500 FU.
The dough developing time is defined as the time between the start of the test (water addition) and the start of the decline of the dough firmness.
The stability is defined as the time between the first and the second point of intersection of the upper mixing curve with the consistency line at 500 FU (i.e. the time in which a part of the curve is located above the consistency line).
Dough softening is the difference between the consistency line at 500 FU and the centre line of the mixing curve and is determined 12 minutes after the dough developing time.
The farinograph quality number is the point of the curve in millimetres to which the centre line of the mixing curve has fallen after the maximum at 30 FU.
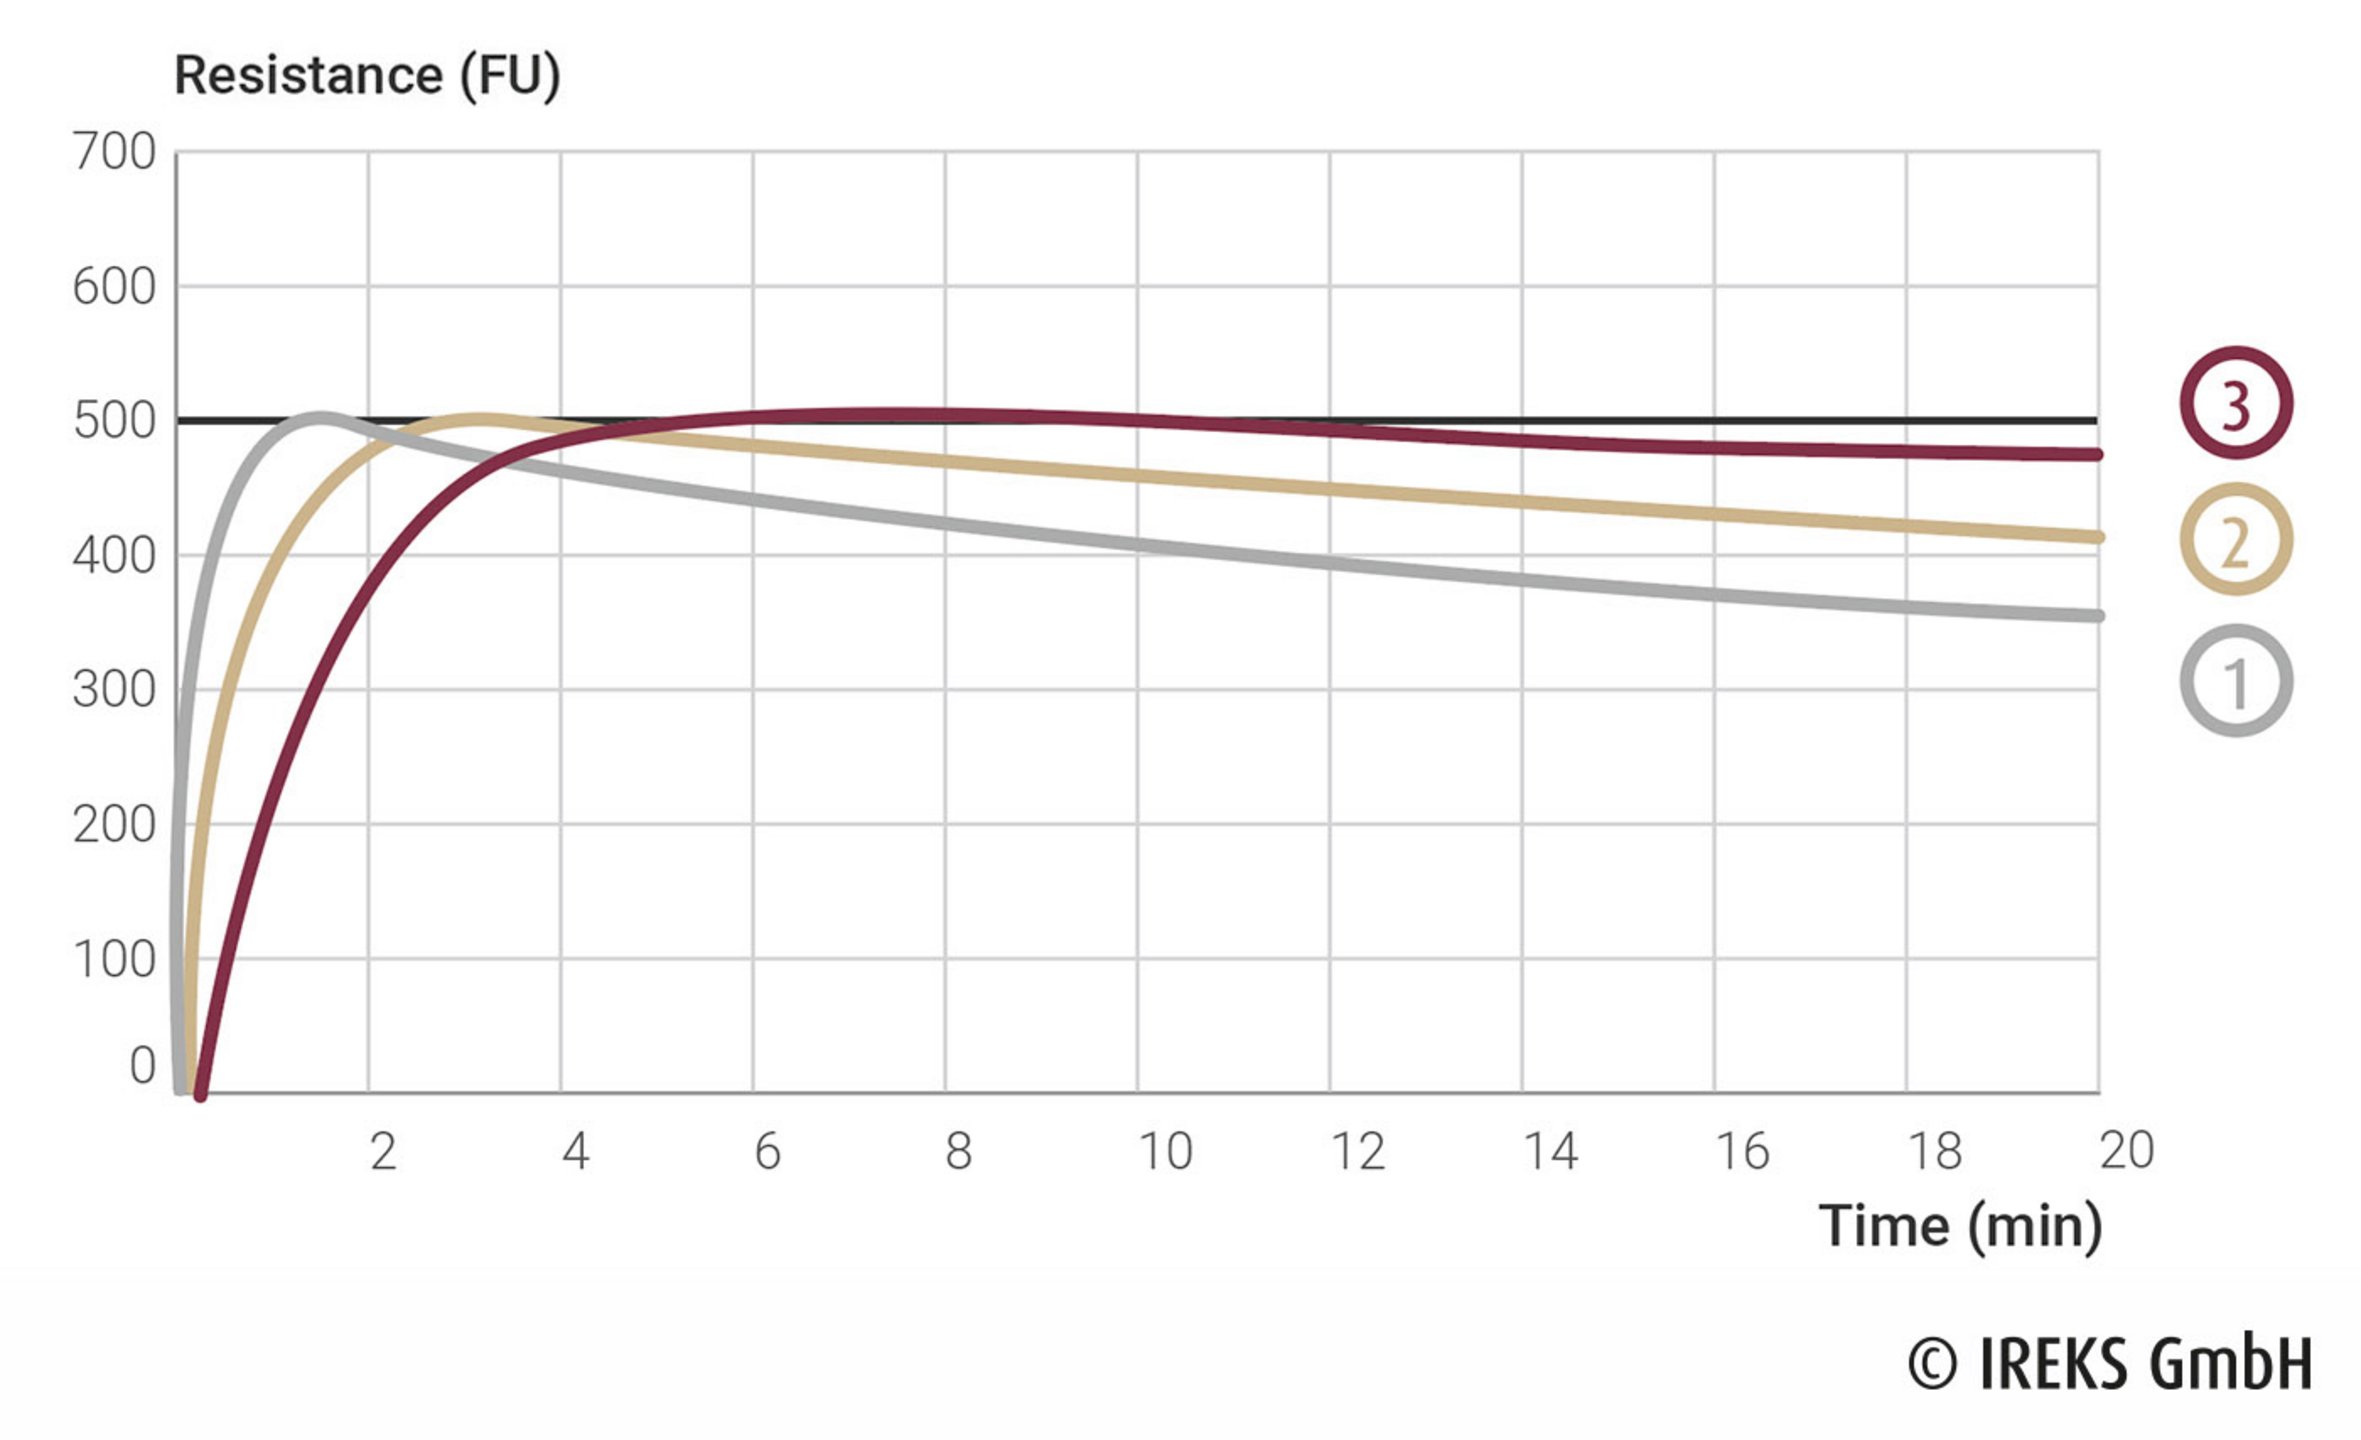
Based on a farinogram and the measuring parameters such as water absorption, dough developing time, stability and dough softening, it can be recognized whether an addition of water or mixing times have to be adjusted in practice.